
Page 17 -
P. 17
3 Analytical Insights
This report examines the sources of drivers for renewable energy innovations. In
particular, it compares data across clean technology fields to determine the observed
historical differences between the fields and the opportunities for tailored innovation
policies and strategies that are specific to the energy technology of interest. It describes
the revealed sources of energy innovations from a variety of perspectives and then
identifies the morphologies of innovation in each technology area that have historically
led to breakthrough technical and commercial innovations.
3.1 Historical Macro Sources of Clean Energy Inventive Activity
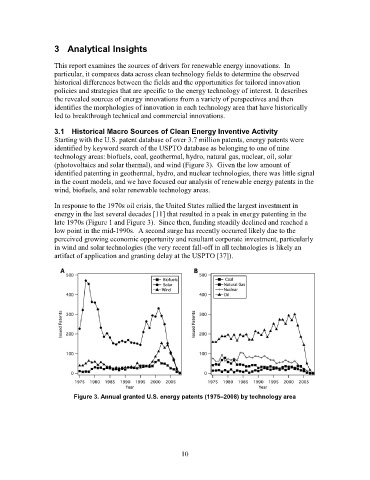
Starting with the U.S. patent database of over 3.7 million patents, energy patents were
identified by keyword search of the USPTO database as belonging to one of nine
technology areas: biofuels, coal, geothermal, hydro, natural gas, nuclear, oil, solar
(photovoltaics and solar thermal), and wind (Figure 3). Given the low amount of
identified patenting in geothermal, hydro, and nuclear technologies, there was little signal
in the count models, and we have focused our analysis of renewable energy patents in the
wind, biofuels, and solar renewable technology areas.
In response to the 1970s oil crisis, the United States rallied the largest investment in
energy in the last several decades [11] that resulted in a peak in energy patenting in the
late 1970s (Figure 1 and Figure 3). Since then, funding steadily declined and reached a
low point in the mid-1990s. A second surge has recently occurred likely due to the
perceived growing economic opportunity and resultant corporate investment, particularly
in wind and solar technologies (the very recent fall-off in all technologies is likely an
artifact of application and granting delay at the USPTO [37]).
Figure 3. Annual granted U.S. energy patents (1975–2008) by technology area
10