
Page 20 -
P. 20
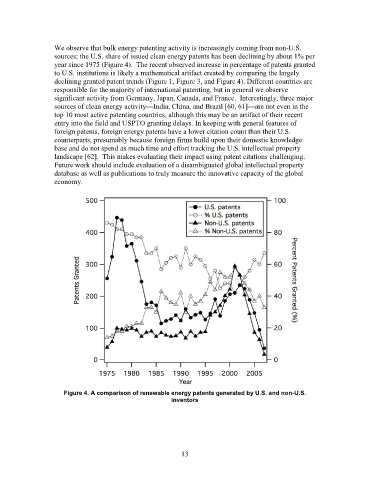
We observe that bulk energy patenting activity is increasingly coming from non-U.S.
                   sources; the U.S. share of issued clean energy patents has been declining by about 1% per
                   year since 1975 (Figure 4).  The recent observed increase in percentage of patents granted
                   to U.S. institutions is likely a mathematical artifact created by comparing the largely
                   declining granted patent trends (Figure 1, Figure 3, and Figure 4). Different countries are
                   responsible for the majority of international patenting, but in general we observe
                   significant activity from Germany, Japan, Canada, and France.  Interestingly, three major
                   sources of clean energy activity—India, China, and Brazil [60, 61]—are not even in the
                   top 10 most active patenting countries, although this may be an artifact of their recent
                   entry into the field and USPTO granting delays. In keeping with general features of
                   foreign patents, foreign energy patents have a lower citation count than their U.S.
                   counterparts, presumably because foreign firms build upon their domestic knowledge
                   base and do not spend as much time and effort tracking the U.S. intellectual property
                   landscape [62].  This makes evaluating their impact using patent citations challenging.
                   Future work should include evaluation of a disambiguated global intellectual property
                   database as well as publications to truly measure the innovative capacity of the global
                   economy.


                      Figure 4. A comparison of renewable energy patents generated by U.S. and non-U.S.
                                                          inventors


                                                             13