
Page 23 -
P. 23
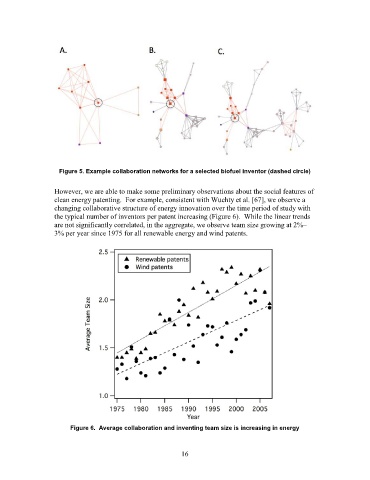
Figure 5. Example collaboration networks for a selected biofuel inventor (dashed circle)


                   However, we are able to make some preliminary observations about the social features of
                   clean energy patenting.  For example, consistent with Wuchty et al. [67], we observe a
                   changing collaborative structure of energy innovation over the time period of study with
                   the typical number of inventors per patent increasing (Figure 6).  While the linear trends
                   are not significantly correlated, in the aggregate, we observe team size growing at 2%–
                   3% per year since 1975 for all renewable energy and wind patents.


                        Figure 6.  Average collaboration and inventing team size is increasing in energy


                                                             16