
Page 24 -
P. 24
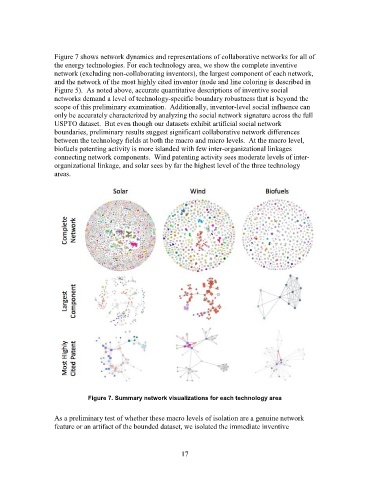
Figure 7 shows network dynamics and representations of collaborative networks for all of
                   the energy technologies. For each technology area, we show the complete inventive
                   network (excluding non-collaborating inventors), the largest component of each network,
                   and the network of the most highly cited inventor (node and line coloring is described in
                   Figure 5).  As noted above, accurate quantitative descriptions of inventive social
                   networks demand a level of technology-specific boundary robustness that is beyond the
                   scope of this preliminary examination.  Additionally, inventor-level social influence can
                   only be accurately characterized by analyzing the social network signature across the full
                   USPTO dataset.  But even though our datasets exhibit artificial social network
                   boundaries, preliminary results suggest significant collaborative network differences
                   between the technology fields at both the macro and micro levels.  At the macro level,
                   biofuels patenting activity is more islanded with few inter-organizational linkages
                   connecting network components.  Wind patenting activity sees moderate levels of inter-
                   organizational linkage, and solar sees by far the highest level of the three technology
                   areas.


                              Figure 7. Summary network visualizations for each technology area


                   As a preliminary test of whether these macro levels of isolation are a genuine network
                   feature or an artifact of the bounded dataset, we isolated the immediate inventive


                                                             17