Page 57 - Compact Numerical Methods For Computers
P. 57

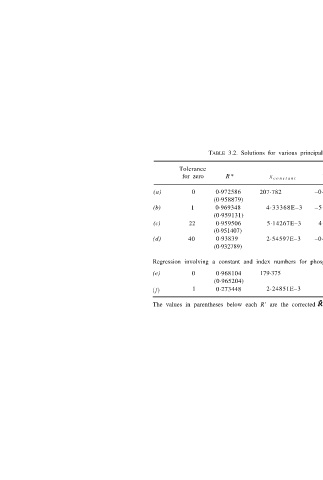
TABLE  3.2. Solutions for various principal-component regressions using the data in table 3.1.

                                                       Tolerance
                                                        for zero     R*           x c o n s t a n t  X nitrogen  x phosphate      x c o t a s h  x petroleum


                                               (a)         0      0·972586     207·782          –0·046191        1·0194        –0·15983         –0·290373
                                                                 (0·958879)
                                               (b)        1       0·969348       4·33368E–3     –5·85314E–2      1·1757        –0·252296         0·699621
                                                                 (0·959131)
                                               (c)        22      0·959506       5·14267E–3      4·34851E–2      0·392026      –6·93389E–2       1·0115
                                                                 (0·951407)
                                               (d)       40       0·93839        2·54597E–3     –0·15299         0·300127       0·469294         0·528881
                                                                 (0·932789)
                                               Regression involving a constant and index numbers for phosphate

                                               (e)         0      0·968104     179·375              —            0·518966                           —
                                                                 (0·965204)
                                               ( f )       1      0·273448       2·24851E–3                      0·945525           —

                                               The values in parentheses below each R’ are the corrected  statistic given by formula (3.52).
   52   53   54   55   56   57   58   59   60   61   62