
Page 257 - Compression Machinery for Oil and Gas
P. 257
242 SECTION II Types of Equipment
Transient torsional stress calculations are accomplished by first translating each
of the torque values for the section in question to stress by normal strength and
material relationships, and taking the outside and inside diameters into account.
A stress diameter is determined that corresponds to the smallest diameter in that
particular element section.
The stress variation is clearly complex in the resulting time histories. Its
application to fatigue analysis is accomplished using Miner’s linear damage
rule, as implemented in the “rain flow” cycle counting algorithm. This algo-
rithm extracts from the complex stress variation, a count of the number of
cycles, as a function of stress range. For each of these stress ranges, the S-N
diagram of the material in question is queried to establish the number of cycles
to failure at this stress range. The fractional damage is calculated as the ratio of
actual number of cycles at this stress range divided by the number of cycles to
fail at the stress range. Cumulative damage at each stress range for the entire
cycle is totaled to give cumulative damage per event. The allowed number
of transients is the inverse of this damage per event.
During the transient torsional analysis, system integrity is investigated using
an ultimate strength reduction approach, as described previously in the Allow-
able Stress Methodology section. This approach relates stress limits for high
cycle fatigue to the UTS. In addition, the maximum shear strength and low cycle
fatigue limit are necessary and calculated for the transient analysis. The max-
imum shear strength for the transient analysis is provided in Eq. (5.14).
A factor of 0.9 is applied to the maximum shear strength to arrive at the low
3
cycle fatigue limit (10 cycles). Note that the safety factor (assumption) is
roughly equivalent to the term design factor (result). A safety factor of 1.1 is
assumed for the max shear stress and low cycle fatigue limit, while a 1.5 safety
6
factor is used in the high cycle fatigue limit (10 cycles). It is noted that the
larger safety factor of 1.5 is applied to the high cycle fatigue limit because
of the many uncertainties associated with the high cycle fatigue calculations.
The assumed safety factor is reduced to 1.1 for the max shear stress and low
cycle fatigue limit because less uncertainty exists regarding the mean loading
and the allowable stress values at zero to low cycles.
The low and high cycle stress limits are calculated for each element in the
torsional model and printed on each relevant stress plot. These limits allow for
the construction of an S-N diagram, constant at the low cycle limit for 1 to
6
3
1 10 cycles, constant from 1 10 cycles to an infinite number of cycles,
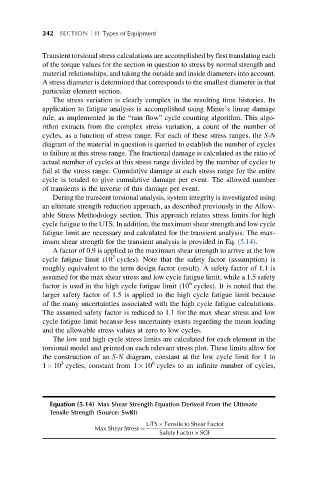
Equation (5.14) Max Shear Strength Equation Derived From the Ultimate
Tensile Strength (Source: SwRI)
UTS Tensile to Shear Factor
Max Shear Stress ¼
Safety Factor SCF