
Page 411 - Compression Machinery for Oil and Gas
P. 411
390 SECTION III Applications
PRESENT VALUE
1500 PSIA MAOP-500 MMSCFD
3500
40 STNS NOTE: EACH LINE REPRESENTS 12
POINTS, THE FIRST ON THE LEFT IS
WITH 40 STATIONS, 50 MILES APART AND
THE LAST POINT ON THE RIGHT IS WITH 2
3000
STATIONS, 1000 MILES APART.
32 STNS
PRESENT VALUE, $MM 2500 24 STNS 16 STNS
28 STNS
20 STNS
2000
13 STNS
10 STNS
8 STNS 4 STNS 2 STNS
6 STNS
1500
1000
18 23 28 33 38 43
THEORETICAL PIPE O.D., in
2.2R 2.0R 1.8R 1.6R 1.4R 1.3R 1.2R
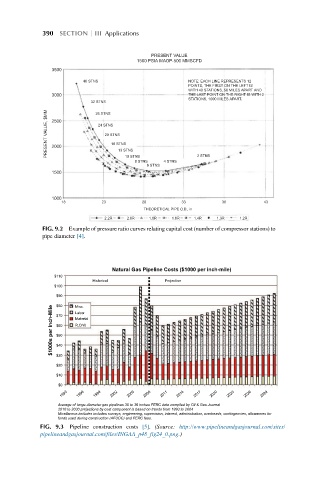
FIG. 9.2 Example of pressure ratio curves relating capital cost (number of compressor stations) to
pipe diameter [4].
Natural Gas Pipeline Costs ($1000 per inch-mile)
$110
Historical Projection
$100
$90 Misc.
$1000s per Inch-Mile $70 Labor
$80
Material
$60
R.O.W.
$50
$40
$30
$20
$10
$0
1993 1996 1999 2002 2005 2008 2011 2014 2017 2020 2023 2026 2029
Average of large-diameter gas pipelines 30 to 36 inches FERC data compiled by Oil & Gas Journal
2010 to 2030 projections by cost component is based on trends from 1993 to 2004
Micellaneus includes includes surveys, engineering, supervision, interest, administration, overheads, contingencies, allowances for
funds used during construction (AFUDC) and FERC fees.
FIG. 9.3 Pipeline construction costs [5]. (Source: http://www.pipelineandgasjournal.com/sites/
pipelineandgasjournal.com/files/INGAA_p48_fig24_0.png.)