
Page 113 - Computational Colour Science Using MATLAB
P. 113
100 CHROMATIC-ADAPTATION TRANSFORMS AND COLOUR APPEARANCE
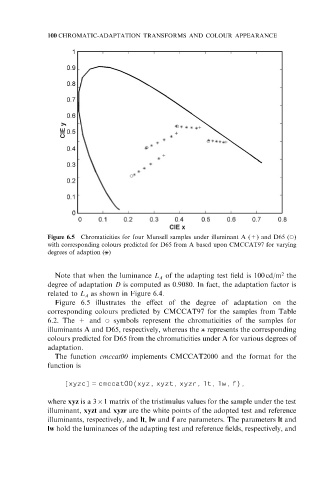
Figure 6.5 Chromaticities for four Munsell samples under illuminant A (+) and D65 (*)
with corresponding colours predicted for D65 from A based upon CMCCAT97 for varying
degrees of adaption ( )
2
Note that when the luminance L of the adapting test field is 100 cd/m the
A
degree of adaptation D is computed as 0.9080. In fact, the adaptation factor is
related to L as shown in Figure 6.4.
A
Figure 6.5 illustrates the effect of the degree of adaptation on the
corresponding colours predicted by CMCCAT97 for the samples from Table
6.2. The + and * symbols represent the chromaticities of the samples for
illuminants A and D65, respectively, whereas the represents the corresponding
colours predicted for D65 from the chromaticities under A for various degrees of
adaptation.
The function cmccat00 implements CMCCAT2000 and the format for the
function is
[xyzc] = cmccat00(xyz, xyzt, xyzr, lt, lw, f),
where xyz is a 361 matrix of the tristimulus values for the sample under the test
illuminant, xyzt and xyzr are the white points of the adopted test and reference
illuminants, respectively, and lt, lw and f are parameters. The parameters lt and
lw hold the luminances of the adapting test and reference fields, respectively, and