
Page 126 - Computational Colour Science Using MATLAB
P. 126
THE GOG MODEL 113
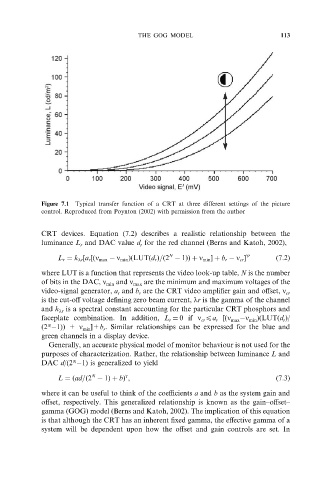
Figure 7.1 Typical transfer function of a CRT at three different settings of the picture
control. Reproduced from Poynton (2002) with permission from the author
CRT devices. Equation (7.2) describes a realistic relationship between the
luminance L and DAC value d for the red channel (Berns and Katoh, 2002),
r r
N gr
L r ¼ k lr ½a r ½ðn max n min ÞðLUTðd r Þ=ð2 1ÞÞ þ n min þ b r n cr ð7:2Þ
where LUT is a function that represents the video look-up table, N is the number
are the minimum and maximum voltages of the
min max
of bits in the DAC, n and n
r r cr
video-signal generator, a and b are the CRT video amplifier gain and offset, n
is the cut-off voltage defining zero beam current, lr is the gamma of the channel
and k is a spectral constant accounting for the particular CRT phosphors and
lr
)(LUT(d )/
r cr r max min r
faceplate combination. In addition, L ¼ 0if n 4a [(n n
N ]+b . Similar relationships can be expressed for the blue and
(2 1)) + n min r
green channels in a display device.
Generally, an accurate physical model of monitor behaviour is not used for the
purposes of characterization. Rather, the relationship between luminance L and
N
DAC d/(2 1) is generalized to yield
N
L ¼ðad=ð2 1Þþ bÞ , ð7:3Þ
g
where it can be useful to think of the coefficients a and b as the system gain and
offset, respectively. This generalized relationship is known as the gain–offset–
gamma (GOG) model (Berns and Katoh, 2002). The implication of this equation
is that although the CRT has an inherent fixed gamma, the effective gamma of a
system will be dependent upon how the offset and gain controls are set. In