
Page 129 - Computational Colour Science Using MATLAB
P. 129
116 CHARACTERIZATION OF COMPUTER DISPLAYS
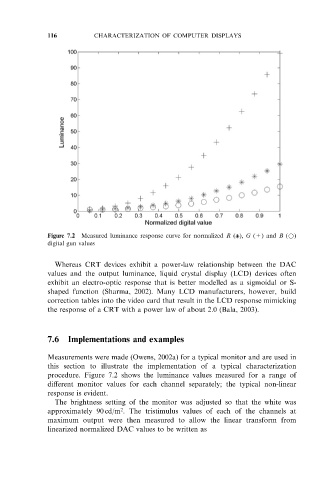
Figure 7.2 Measured luminance response curve for normalized R (), G (+) and B (*)
digital gun values
Whereas CRT devices exhibit a power-law relationship between the DAC
values and the output luminance, liquid crystal display (LCD) devices often
exhibit an electro-optic response that is better modelled as a sigmoidal or S-
shaped function (Sharma, 2002). Many LCD manufacturers, however, build
correction tables into the video card that result in the LCD response mimicking
the response of a CRT with a power law of about 2.0 (Bala, 2003).
7.6 Implementations and examples
Measurements were made (Owens, 2002a) for a typical monitor and are used in
this section to illustrate the implementation of a typical characterization
procedure. Figure 7.2 shows the luminance values measured for a range of
different monitor values for each channel separately; the typical non-linear
response is evident.
The brightness setting of the monitor was adjusted so that the white was
2
approximately 90 cd/m . The tristimulus values of each of the channels at
maximum output were then measured to allow the linear transform from
linearized normalized DAC values to be written as