
Page 133 - Computational Colour Science Using MATLAB
P. 133
120 CHARACTERIZATION OF COMPUTER DISPLAYS
% now compute the error for the test samples
for i = 1:7
[lab1] = xyz2lab(XYZ(i,:),’d65___64’);
[lab2] = xyz2lab(AXYZ(i,:),’d65___64’);
[thisDE] = cielabde(lab1,lab2);
de(i) = thisDE;
end
disp(’test values’)
disp(de)
In the preceding code the matrices r, g and b contain the DAC RGB values
and the measured XYZ values for the pure channel colours. The matrix
N contains the data for the five neutral samples (see Table 7.1) and the
matrix T contains data for the seven test samples. The function gogtest computes
the root-mean-squared error between actual DAC values and the predicted DAC
values. The required inputs to the gogtest function are gogs (a 261 column
matrix containing the gamma and gain terms, respectively), dacs (an n61
column matrix of normalized RGB values) and rgbs (an n61 column matrix of
predicted RGB values). The predicted RGB values are obtained by inverting
Equation (7.6) and using the measured XYZ values. The format of the call to
gogtest is
[err] = gogtest(gogs,dacs,rgbs)
where the returned 161 matrix err contains the error using the GOG parameters
defined by gogs. This function is useful since it allows gogs to be optimized for
the minimum value of err using a suitable optimization method.
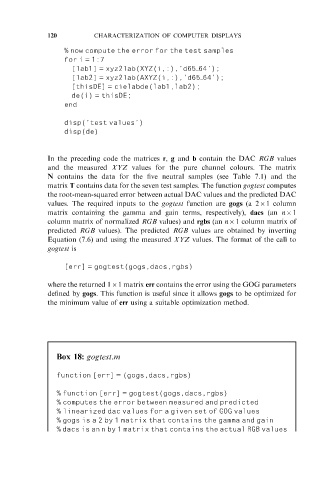
Box 18: gogtest.m
function [err] = (gogs,dacs,rgbs)
% function [err] = gogtest(gogs,dacs,rgbs)
% computes the error between measured and predicted
% linearized dac values for a given set of GOG values
% gogs is a 2 by 1 matrix that contains the gamma and gain
% dacs is an n by 1 matrix that contains the actual RGB values