
Page 193 - Computational Colour Science Using MATLAB
P. 193
180 MULTISPECTRAL IMAGING
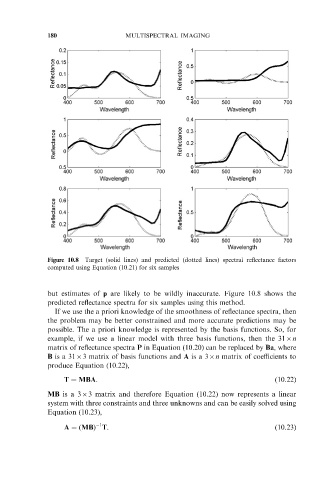
Figure 10.8 Target (solid lines) and predicted (dotted lines) spectral reflectance factors
computed using Equation (10.21) for six samples
but estimates of p are likely to be wildly inaccurate. Figure 10.8 shows the
predicted reflectance spectra for six samples using this method.
If we use the a priori knowledge of the smoothness of reflectance spectra, then
the problem may be better constrained and more accurate predictions may be
possible. The a priori knowledge is represented by the basis functions. So, for
example, if we use a linear model with three basis functions, then the 316n
matrix of reflectance spectra P in Equation (10.20) can be replaced by Ba, where
B is a 3163 matrix of basis functions and A is a 36n matrix of coefficients to
produce Equation (10.22),
T ¼ MBA. ð10.22Þ
MB is a 363 matrix and therefore Equation (10.22) now represents a linear
system with three constraints and three unknowns and can be easily solved using
Equation (10.23),
1
A ¼ðMBÞ T. ð10.23Þ