
Page 188 - Computational Colour Science Using MATLAB
P. 188
IMPLEMENTATIONS AND EXAMPLES 175
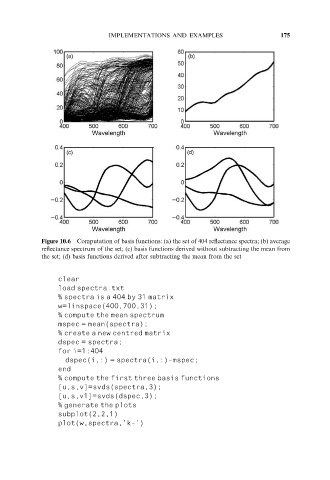
Figure 10.6 Computation of basis functions: (a) the set of 404 reflectance spectra; (b) average
reflectance spectrum of the set; (c) basis functions derived without subtracting the mean from
the set; (d) basis functions derived after subtracting the mean from the set
clear
load spectra.txt
% spectra is a 404 by 31 matrix
w=linspace(400,700,31);
% compute the mean spectrum
mspec = mean(spectra);
% create a new centred matrix
dspec = spectra;
for i=1:404
dspec(i,:) = spectra(i,:)-mspec;
end
% compute the first three basis functions
[u,s,v]=svds(spectra,3);
[u,s,v1]=svds(dspec,3);
% generate the plots
subplot(2,2,1)
plot(w,spectra,’k-’)