
Page 186 - Computational Colour Science Using MATLAB
P. 186
IMPLEMENTATIONS AND EXAMPLES 173
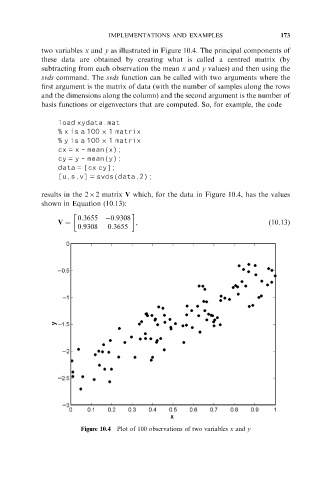
two variables x and y as illustrated in Figure 10.4. The principal components of
these data are obtained by creating what is called a centred matrix (by
subtracting from each observation the mean x and y values) and then using the
svds command. The svds function can be called with two arguments where the
first argument is the matrix of data (with the number of samples along the rows
and the dimensions along the column) and the second argument is the number of
basis functions or eigenvectors that are computed. So, for example, the code
load xydata.mat
% x is a 100 1 matrix
% y is a 100 1 matrix
cx = x - mean(x);
cy = y - mean(y);
data = [cx cy];
[u,s,v] = svds(data,2);
results in the 262 matrix V which, for the data in Figure 10.4, has the values
shown in Equation (10.13):
0:3655 0:9308
,
0:9308 0:3655
V ¼ ð10.13Þ
Figure 10.4 Plot of 100 observations of two variables x and y