
Page 182 - Computational Colour Science Using MATLAB
P. 182
COMPUTATIONAL COLOUR CONSTANCY AND LINEAR MODELS 169
three basis functions (also known as eigenvectors) computed for a set of
reflectance spectra measured from a CMYK printing process. The figure shows
the approximation of one of the spectra by one, two and three basis functions.
When three basis functions are used the approximation is quite a good fit to the
measured values.
It is not trivial, however, to ascertain how many basis functions are required
for an accurate representation without reference to the purpose of the
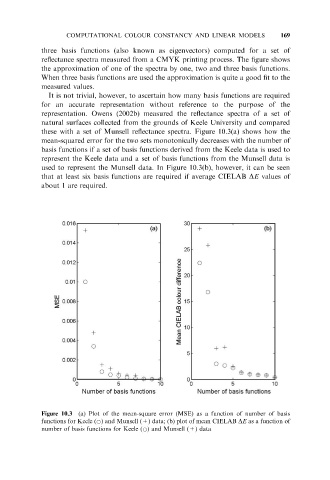
representation. Owens (2002b) measured the reflectance spectra of a set of
natural surfaces collected from the grounds of Keele University and compared
these with a set of Munsell reflectance spectra. Figure 10.3(a) shows how the
mean-squared error for the two sets monotonically decreases with the number of
basis functions if a set of basis functions derived from the Keele data is used to
represent the Keele data and a set of basis functions from the Munsell data is
used to represent the Munsell data. In Figure 10.3(b), however, it can be seen
that at least six basis functions are required if average CIELAB DE values of
about 1 are required.
Figure 10.3 (a) Plot of the mean-square error (MSE) as a function of number of basis
functions for Keele (*) and Munsell (+) data; (b) plot of mean CIELAB DE as a function of
number of basis functions for Keele (*) and Munsell (+) data