
Page 194 - Computational Colour Science Using MATLAB
P. 194
IMPLEMENTATIONS AND EXAMPLES 181
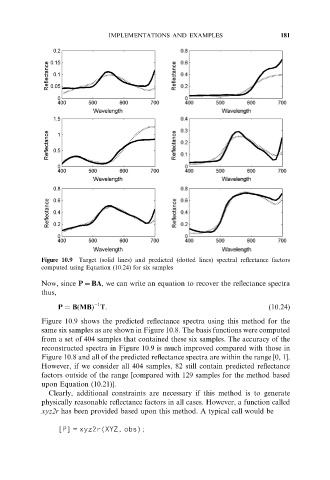
Figure 10.9 Target (solid lines) and predicted (dotted lines) spectral reflectance factors
computed using Equation (10.24) for six samples
Now, since P ¼ BA, we can write an equation to recover the reflectance spectra
thus,
1
P ¼ BðMBÞ T. ð10.24Þ
Figure 10.9 shows the predicted reflectance spectra using this method for the
same six samples as are shown in Figure 10.8. The basis functions were computed
from a set of 404 samples that contained these six samples. The accuracy of the
reconstructed spectra in Figure 10.9 is much improved compared with those in
Figure 10.8 and all of the predicted reflectance spectra are within the range [0, 1].
However, if we consider all 404 samples, 82 still contain predicted reflectance
factors outside of the range [compared with 129 samples for the method based
upon Equation (10.21)].
Clearly, additional constraints are necessary if this method is to generate
physically reasonable reflectance factors in all cases. However, a function called
xyz2r has been provided based upon this method. A typical call would be
[P] = xyz2r(XYZ, obs);