
Page 219 - Computational Fluid Dynamics for Engineers
P. 219
Problems 207
Table P6.1. Coordinates of the NACA 65 3-018 airfoil.
x/c y/c x/c y/c
0.005 0.01337 0.45 0.08901
0.0075 0.01608 0.50 0.08568
0.0125 0.02014 0.55 0.08008
0.0250 0.02751 0.60 0.07267
0.050 0.03866 0.65 0.06395
0.075 0.04733 0.70 0.05426
0.10 0.05457 0.75 0.04396
0.15 0.06606 0.80 0.03338
0.20 0.07476 0.85 0.02295
0.25 0.08129 0.90 0.01319
0.30 0.08595 0.95 0.00490
0.35 0.08886 1.0 0
0.40 0.08999
1.6
1.2
/ \
0.8
V 0.0
3 -0.4
p /
"5 -0.8
-1.2 ^ /
-1.6
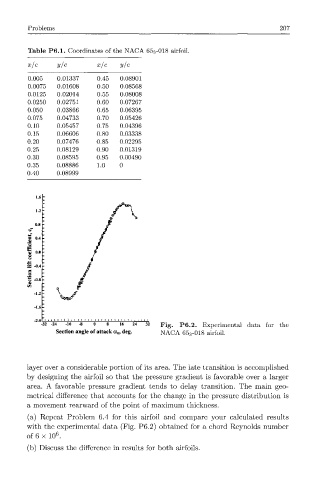
-32 -24 - 1 6 - 8 0 8 16 24 Fig. P6.2. Experimental data for the
Section angle of attack Oo, deg. NACA 65 3-018 airfoil.
layer over a considerable portion of its area. The late transition is accomplished
by designing the airfoil so that the pressure gradient is favorable over a larger
area. A favorable pressure gradient tends to delay transition. The main geo-
metrical difference that accounts for the change in the pressure distribution is
a movement rearward of the point of maximum thickness.
(a) Repeat Problem 6.4 for this airfoil and compare your calculated results
with the experimental data (Fig. P6.2) obtained for a chord Reynolds number
6
of 6 x 10 .
(b) Discuss the difference in results for both airfoils.