
Page 285 - Computational Modeling in Biomedical Engineering and Medical Physics
P. 285
274 Computational Modeling in Biomedical Engineering and Medical Physics
process, an equivalent steady flow was defined, based on the averaging of the inlet veloc-
ity over each period τ of the pulsating flow (Morega et al., 2014)
ð τ q ffiffiffiffiffiffiffiffiffiffiffiffiffiffiffiffiffiffi
1
2
U av 5 U inlet ðtÞdt; where U inlet ðtÞ 5 U 0 sin 2πftÞ 1 sin 2πftÞ : ð8:14Þ
ð
ð
τ 0
In that way, the second step of the numerical procedure is performed. For particu-
lar data used in this study, U inlet 5 40 cm/s, f 5 60 bpm and U av 5 25.5 cm/s. The
unsteady heat transfer, (8.11b) and (8.13), is finally solved.
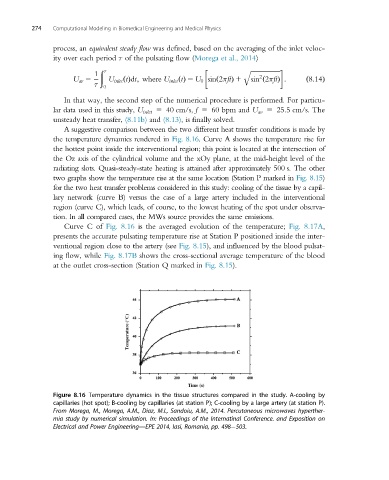
A suggestive comparison between the two different heat transfer conditions is made by
the temperature dynamics rendered in Fig. 8.16. Curve A shows the temperature rise for
the hottest point inside the interventional region; this point is located at the intersection of
the Oz axis of the cylindrical volume and the xOy plane, at the mid-height level of the
radiating slots. Quasi-steady-state heating is attained after approximately 500 s. The other
two graphs show the temperature rise at the same location (Station P marked in Fig. 8.15)
for the two heat transfer problems considered in this study: cooling of the tissue by a capil-
lary network (curve B) versus the case of a large artery included in the interventional
region (curve C), which leads, of course, to the lowest heating of the spot under observa-
tion. In all compared cases, the MWs source provides the same emissions.
Curve C of Fig. 8.16 is the averaged evolution of the temperature; Fig. 8.17A,
presents the accurate pulsating temperature rise at Station P positioned inside the inter-
ventional region close to the artery (see Fig. 8.15), and influenced by the blood pulsat-
ing flow, while Fig. 8.17B shows the cross-sectional average temperature of the blood
at the outlet cross-section (Station Q marked in Fig. 8.15).
Figure 8.16 Temperature dynamics in the tissue structures compared in the study. A-cooling by
capillaries (hot spot); B-cooling by capillaries (at station P); C-cooling by a large artery (at station P).
From Morega, M., Morega, A.M., Diaz, M.I., Sandoiu, A.M., 2014. Percutaneous microwaves hyperther-
mia study by numerical simulation. In: Proceedings of the Internatinal Conference. and Exposition on
Electrical and Power Engineering—EPE 2014, Iasi, Romania, pp. 498 503.