
Page 283 - Computational Modeling in Biomedical Engineering and Medical Physics
P. 283
272 Computational Modeling in Biomedical Engineering and Medical Physics
3
910 mm volume of tissue heated within the range of 41.4 C 44.2 C. The unsteady
heating process was also analyzed for further comparison with other heat transfer condi-
tions (see curves in Fig. 8.14).
The physical properties of tissues represent a category of crucial data for numeri-
cal simulation and analysis. Not only that all kinds of complications arise when
in vivo assessments are needed, but the measured values present relatively large dis-
persion ranges due to inherent factors, like water and other chemical content,
homeostasis, or other activity of the living organism, etc. The models show different
degrees of sensitivity to various data, and for the hyperthermia problem, the vascu-
larization efficiency quantified by the blood perfusion rate is one of the most influential
factors of the heating process, while dielectric or thermal properties (see Table 8.4
for a complete list) do not affect in a comparable measure the behavior of the
model and the results. A detailed study on this topic is performed in Morega et al.
(2015a); the results of a parametric study are further shown for the variation of the
perfusion rate in reasonable limits around the reference value previously used
ω b 5 6:4 3 10 23 =s.
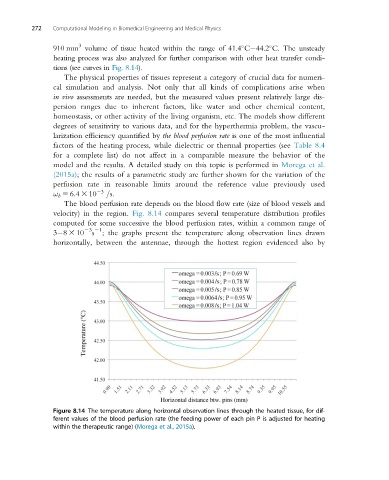
The blood perfusion rate depends on the blood flow rate (size of blood vessels and
velocity) in the region. Fig. 8.14 compares several temperature distribution profiles
computed for some successive the blood perfusion rates, within a common range of
s
3 8 3 10 23 21 ; the graphs present the temperature along observation lines drawn
horizontally, between the antennae, through the hottest region evidenced also by
Figure 8.14 The temperature along horizontal observation lines through the heated tissue, for dif-
ferent values of the blood perfusion rate (the feeding power of each pin P is adjusted for heating
within the therapeutic range) (Morega et al., 2015a).