
Page 71 - Computational Modeling in Biomedical Engineering and Medical Physics
P. 71
58 Computational Modeling in Biomedical Engineering and Medical Physics
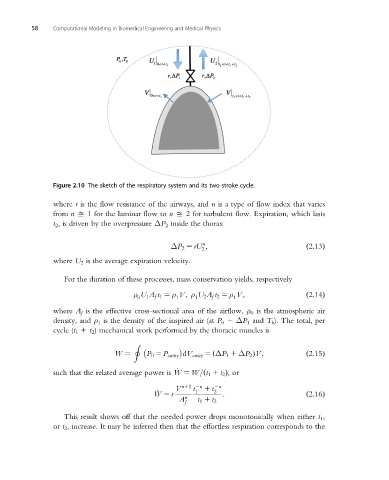
Figure 2.10 The sketch of the respiratory system and its two-stroke cycle.
where r is the flow resistance of the airways, and n is a type of flow index that varies
from n D 1 for the laminar flow to n D 2 for turbulent flow. Expiration, which lasts
t 2 , is driven by the overpressure ΔP 2 inside the thorax
n
ΔP 2 5 rU ;
2 ð2:13Þ
where U 2 is the average expiration velocity.
For the duration of these processes, mass conservation yields, respectively
ρ U 1 A f t 1 5 ρ V; ρ U 2 A f t 2 5 ρ V;
0 1 1 1 ð2:14Þ
where A f is the effective cross-sectional area of the airflow, ρ 0 is the atmospheric air
density, and ρ 1 is the density of the inspired air (at P 0 ΔP 1 and T b ). The total, per
cycle (t 1 1 t 2 ) mechanical work performed by the thoracic muscles is
I
W 5 P 0 5 P cavity dV cavity 5 ΔP 1 1 ΔP 2 ÞV; ð2:15Þ
ð
such that the related average power is _ W 5 W= t 1 1 t 2 Þ,or
ð
t
_
1
W 5 r V n11 2n 1 t 2 2n : ð2:16Þ
A n t 1 1 t 2
f
This result shows off that the needed power drops monotonically when either t 1 ,
or t 2 , increase. It may be inferred then that the effortless respiration corresponds to the