
Page 70 - Computational Modeling in Biomedical Engineering and Medical Physics
P. 70
Shape and structure morphing of systems with internal flows 57
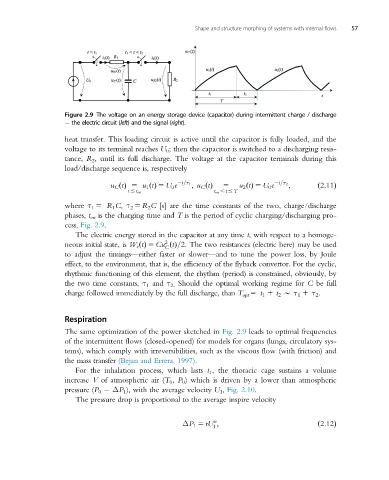
Figure 2.9 The voltage on an energy storage device (capacitor) during intermittent charge / discharge
the electric circuit (left)and the signal(right).
heat transfer. This loading circuit is active until the capacitor is fully loaded, and the
voltage to its terminal reaches U 0 ; then the capacitor is switched to a discharging resis-
tance, R 2 , until its full discharge. The voltage at the capacitor terminals during this
load/discharge sequence is, respectively
u C tðÞ 5 u 1 tðÞ 5 U 0 e 2t=τ 1 ; u C tðÞ 5 u 2 tðÞ 5 U 0 e 2t=τ 2 ; ð2:11Þ
t # t on t on , t # T
where τ 1 5 R 1 C, τ 2 5 R 2 C [s] are the time constants of the two, charge/discharge
phases, t on is the charging time and T is the period of cyclic charging/discharging pro-
cess, Fig. 2.9.
The electric energy stored in the capacitor at any time t, with respect to a homoge-
2
neous initial state, is W e tðÞ 5 Cu tðÞ=2. The two resistances (electric here) may be used
C
to adjust the timings—either faster or slower—and to tune the power loss, by Joule
effect, to the environment, that is, the efficiency of the flyback convertor. For the cyclic,
rhythmic functioning of this element, the rhythm (period) is constrained, obviously, by
the two time constants, τ 1 and τ 2. Should the optimal working regime for C be full
charge followed immediately by the full discharge, than T opt 5 t 1 1 t 2 B τ 1 1 τ 2 .
Respiration
The same optimization of the power sketched in Fig. 2.9 leads to optimal frequencies
of the intermittent flows (closed-opened) for models for organs (lungs, circulatory sys-
tems), which comply with irreversibilities, such as the viscous flow (with friction) and
the mass transfer (Bejan and Errera, 1997).
For the inhalation process, which lasts t 1 , the thoracic cage sustains a volume
increase V of atmospheric air (T 0 , P 0 ) which is driven by a lower than atmospheric
pressure (P 0 ΔP 1 ), with the average velocity U 1 , Fig. 2.10.
The pressure drop is proportional to the average inspire velocity
n
ΔP 1 5 rU ;
1 ð2:12Þ