
Page 94 - Computational Statistics Handbook with MATLAB
P. 94
Chapter 4: Generating Random Variables 81
Histogram of Uniform Random Variables
80
70
60
50
Frequency 40
30
20
10
0
0 0.1 0.2 0.3 0.4 0.5 0.6 0.7 0.8 0.9 1
X
F FI U URE G 4. RE 4. 1 1
IG
1
GU
F F II GU RE RE 4. 4. 1
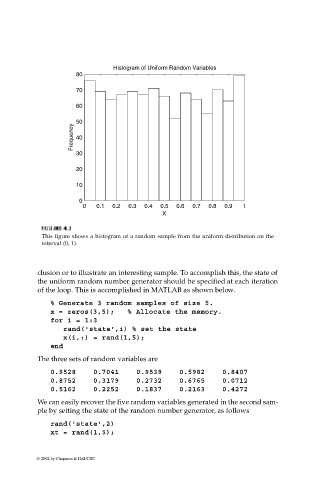
This figure shows a histogram of a random sample from the uniform distribution on the
interval (0, 1).
clusion or to illustrate an interesting sample. To accomplish this, the state of
the uniform random number generator should be specified at each iteration
of the loop. This is accomplished in MATLAB as shown below.
% Generate 3 random samples of size 5.
x = zeros(3,5); % Allocate the memory.
for i = 1:3
rand('state',i) % set the state
x(i,:) = rand(1,5);
end
The three sets of random variables are
0.9528 0.7041 0.9539 0.5982 0.8407
0.8752 0.3179 0.2732 0.6765 0.0712
0.5162 0.2252 0.1837 0.2163 0.4272
We can easily recover the five random variables generated in the second sam-
ple by setting the state of the random number generator, as follows
rand('state',2)
xt = rand(1,5);
© 2002 by Chapman & Hall/CRC