
Page 201 -
P. 201
Section 6.1 Local Texture Representations Using Filters 169
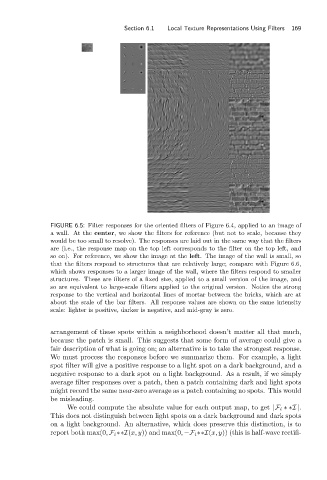
FIGURE 6.5: Filter responses for the oriented filters of Figure 6.4, applied to an image of
a wall. At the center, we show the filters for reference (but not to scale, because they
would be too small to resolve). The responses are laid out in the same way that the filters
are (i.e., the response map on the top left corresponds to the filter on the top left, and
so on). For reference, we show the image at the left. The image of the wall is small, so
that the filters respond to structures that are relatively large; compare with Figure 6.6,
which shows responses to a larger image of the wall, where the filters respond to smaller
structures. These are filters of a fixed size, applied to a small version of the image, and
so are equivalent to large-scale filters applied to the original version. Notice the strong
response to the vertical and horizontal lines of mortar between the bricks, which are at
about the scale of the bar filters. All response values are shown on the same intensity
scale: lighter is positive, darker is negative, and mid-gray is zero.
arrangement of these spots within a neighborhood doesn’t matter all that much,
because the patch is small. This suggests that some form of average could give a
fair description of what is going on; an alternative is to take the strongest response.
We must process the responses before we summarize them. For example, a light
spot filter will give a positive response to a light spot on a dark background, and a
negative response to a dark spot on a light background. As a result, if we simply
average filter responses over a patch, then a patch containing dark and light spots
might record the same near-zero average as a patch containing no spots. This would
be misleading.
We could compute the absolute value for each output map, to get |F i ∗∗I |.
This does not distinguish between light spots on a dark background and dark spots
on a light background. An alternative, which does preserve this distinction, is to
report both max(0, F i ∗∗I(x, y)) and max(0, −F i ∗∗I(x, y)) (this is half-wave rectifi-