
Page 206 -
P. 206
Section 6.2 Pooled Texture Representations by Discovering Textons 174
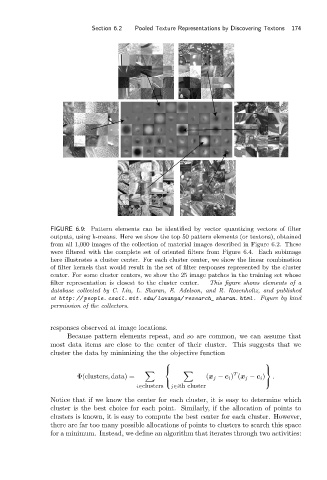
FIGURE 6.9: Pattern elements can be identified by vector quantizing vectors of filter
outputs, using k-means. Here we show the top 50 pattern elements (or textons), obtained
from all 1,000 images of the collection of material images described in Figure 6.2. These
were filtered with the complete set of oriented filters from Figure 6.4. Each subimage
here illustrates a cluster center. For each cluster center, we show the linear combination
of filter kernels that would result in the set of filter responses represented by the cluster
center. For some cluster centers, we show the 25 image patches in the training set whose
filter representation is closest to the cluster center. This figure shows elements of a
database collected by C. Liu, L. Sharan, E. Adelson, and R. Rosenholtz, and published
at http: // people. csail. mit. edu/ lavanya/ research_ sharan. html . Figure by kind
permission of the collectors.
responses observed at image locations.
Because pattern elements repeat, and so are common, we can assume that
most data items are close to the center of their cluster. This suggests that we
cluster the data by minimizing the the objective function
⎧ ⎫
⎨ ⎬
T
Φ(clusters, data) = (x j − c i ) (x j − c i ) .
⎩ ⎭
i∈clusters j∈ith cluster
Notice that if we know the center for each cluster, it is easy to determine which
cluster is the best choice for each point. Similarly, if the allocation of points to
clusters is known, it is easy to compute the best center for each cluster. However,
there are far too many possible allocations of points to clusters to search this space
for a minimum. Instead, we define an algorithm that iterates through two activities: