
Page 318 -
P. 318
Section 9.5 Image Segmentation in Practice 286
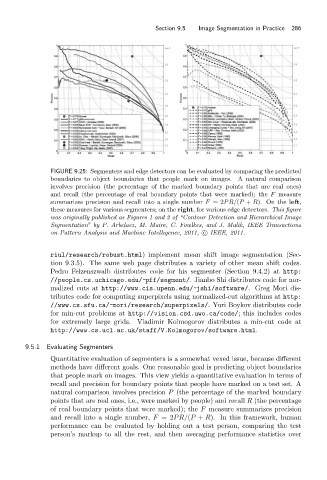
FIGURE 9.25: Segmenters and edge detectors can be evaluated by comparing the predicted
boundaries to object boundaries that people mark on images. A natural comparison
involves precision (the percentage of the marked boundary points that are real ones)
and recall (the percentage of real boundary points that were marked); the F measure
summarizes precision and recall into a single number F =2PR/(P + R). On the left,
these measures for various segmenters; on the right, for various edge detectors. This figure
was originally published as Figures 1 and 2 of “Contour Detection and Hierarchical Image
Segmentation” by P. Arbelaez, M. Maire, C. Fowlkes, and J. Malik, IEEE Transactions
on Pattern Analysis and Machine Intelligence, 2011, c IEEE, 2011.
riul/research/robust.html) implement mean shift image segmentation (Sec-
tion 9.3.5). The same web page distributes a variety of other mean shift codes.
Pedro Felzenszwalb distributes code for his segmenter (Section 9.4.2) at http:
//people.cs.uchicago.edu/ ~ pff/segment/. Jianbo Shi distributes code for nor-
malized cuts at http://www.cis.upenn.edu/ ~ jshi/software/. Greg Mori dis-
tributes code for computing superpixels using normalized-cut algorithms at http:
//www.cs.sfu.ca/ ~ mori/research/superpixels/. Yuri Boykov distributes code
for min-cut problems at http://vision.csd.uwo.ca/code/; this includes codes
for extremely large grids. Vladimir Kolmogorov distributes a min-cut code at
http://www.cs.ucl.ac.uk/staff/V.Kolmogorov/software.html.
9.5.1 Evaluating Segmenters
Quantitative evaluation of segmenters is a somewhat vexed issue, because different
methods have different goals. One reasonable goal is predicting object boundaries
that people mark on images. This view yields a quantitative evaluation in terms of
recall and precision for boundary points that people have marked on a test set. A
natural comparison involves precision P (the percentage of the marked boundary
points that are real ones, i.e., were marked by people) and recall R (the percentage
of real boundary points that were marked); the F measure summarizes precision
and recall into a single number, F =2PR/(P + R). In this framework, human
performance can be evaluated by holding out a test person, comparing the test
person’s markup to all the rest, and then averaging performance statistics over