
Page 323 -
P. 323
Section 10.1 The Hough Transform 291
1
0.8
0.6
0.4
0.2
0
0 0.2 0.4 0.6 0.8 1
1
0.8
0.6
0.4
0.2
0
0 0.2 0.4 0.6 0.8 1
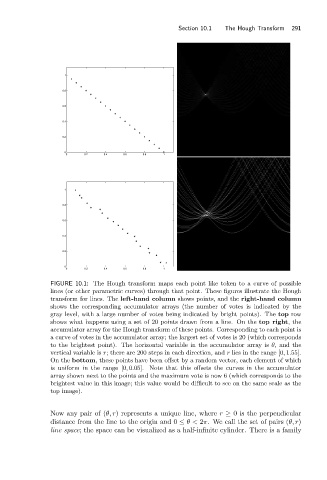
FIGURE 10.1: The Hough transform maps each point like token to a curve of possible
lines (or other parametric curves) through that point. These figures illustrate the Hough
transform for lines. The left-hand column shows points, and the right-hand column
shows the corresponding accumulator arrays (the number of votes is indicated by the
gray level, with a large number of votes being indicated by bright points). The top row
shows what happens using a set of 20 points drawn from a line. On the top right,the
accumulator array for the Hough transform of these points. Corresponding to each point is
a curve of votes in the accumulator array; the largest set of votes is 20 (which corresponds
to the brightest point). The horizontal variable in the accumulator array is θ,and the
vertical variable is r; there are 200 steps in each direction, and r lies in the range [0, 1.55].
On the bottom, these points have been offset by a random vector, each element of which
is uniform in the range [0, 0.05]. Note that this offsets the curves in the accumulator
array shown next to the points and the maximum vote is now 6 (which corresponds to the
brightest value in this image; this value would be difficult to see on the same scale as the
top image).
Now any pair of (θ, r) represents a unique line, where r ≥ 0 is the perpendicular
distance from the line to the origin and 0 ≤ θ< 2π. We call the set of pairs (θ, r)
line space; the space can be visualized as a half-infinite cylinder. There is a family