
Page 278 - Concise Encyclopedia of Robotics
P. 278
Reliability
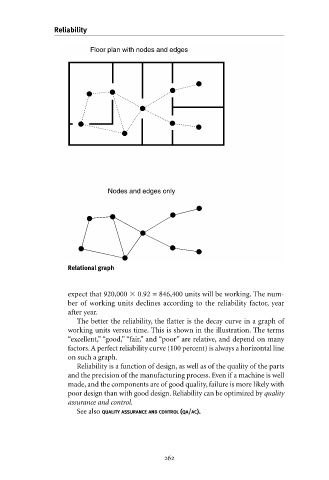
Floor plan with nodes and edges
Nodes and edges only
Relational graph
expect that 920,000 0.92 = 846,400 units will be working. The num-
ber of working units declines according to the reliability factor, year
after year.
The better the reliability, the flatter is the decay curve in a graph of
working units versus time. This is shown in the illustration. The terms
“excellent,” “good,” “fair,” and “poor” are relative, and depend on many
factors.A perfect reliability curve (100 percent) is always a horizontal line
on such a graph.
Reliability is a function of design, as well as of the quality of the parts
and the precision of the manufacturing process. Even if a machine is well
made, and the components are of good quality, failure is more likely with
poor design than with good design. Reliability can be optimized by quality
assurance and control.
See also QUALITY ASSURANCE AND CONTROL (QA/AC).
