
Page 328 - Control Theory in Biomedical Engineering
P. 328
302 Control theory in biomedical engineering
FLX9070
0.1 Power ON Power OFF
Force (N) 0.05
0
490 979 1468 1957 2446 2935 3424 3913 4402 4891 5380 5869 6358 6847 7336 7825 8314 8803 9292
1
–0.05
Data points taken at 100HZ
FLX9070 (0.3A) FLX9070 (0.5A) ON/OFF
Fig. 14 Force graph for material FLX-9070.
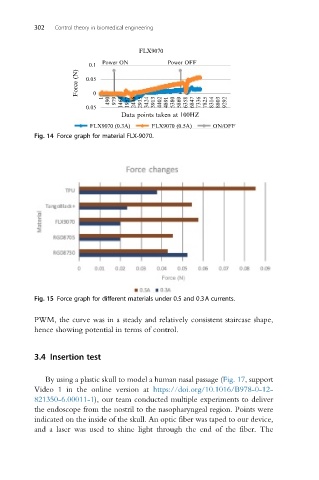
Fig. 15 Force graph for different materials under 0.5 and 0.3A currents.
PWM, the curve was in a steady and relatively consistent staircase shape,
hence showing potential in terms of control.
3.4 Insertion test
By using a plastic skull to model a human nasal passage (Fig. 17, support
Video 1 in the online version at https://doi.org/10.1016/B978-0-12-
821350-6.00011-1), our team conducted multiple experiments to deliver
the endoscope from the nostril to the nasopharyngeal region. Points were
indicated on the inside of the skull. An optic fiber was taped to our device,
and a laser was used to shine light through the end of the fiber. The