
Page 327 - Control Theory in Biomedical Engineering
P. 327
Continuum NasoXplorer manipulator with shape memory actuators 301
TangoBlack+
1.00E–01
Power ON Power OFF
7.50E–02
5.00E–02
2.50E–02
0.00E+00
1 446 891
–2.50E–02 1336 1781 2226 2671 3116 3561 4006 4451 4896 5341 5786 6231 6676 7121 7566 8011 8456 8901 9346
TB+ (0.3A) TB+ (0.5A) ON/OFF
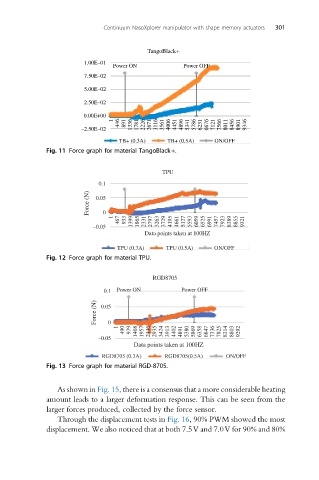
Fig. 11 Force graph for material TangoBlack+.
TPU
0.1
Force (N) 0.05
0
1
467 933 1399 1865 2331 2797 3263 3729 4195 4661 5127 5593 6059 6525 6991 7457 7923 8389 8855 9321
–0.05
Data points taken at 100HZ
TPU (0.3A) TPU (0.5A) ON/OFF
Fig. 12 Force graph for material TPU.
RGD8705
0.1 Power ON Power OFF
Force (N) 0.05
0
490 979 1468 1957 2446 2935 3424 3913 4402 4891 5380 5869 6358 6847 7336 7825 8314 8803 9292
1
–0.05
Data points taken at 100HZ
RGD8705 (0.3A) RGD8705(0.5A) ON/OFF
Fig. 13 Force graph for material RGD-8705.
As shown in Fig. 15, there is a consensus that a more considerable heating
amount leads to a larger deformation response. This can be seen from the
larger forces produced, collected by the force sensor.
Through the displacement tests in Fig. 16, 90% PWM showed the most
displacement. We also noticed that at both 7.5V and 7.0V for 90% and 80%