
Page 543 - Corrosion Engineering Principles and Practice
P. 543
508 C h a p t e r 1 2 C o r r o s i o n a s a R i s k 509
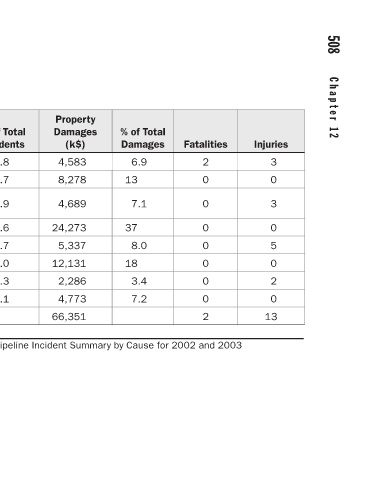
Injuries 3 0 3 0 5 0 2 0 13
Fatalities 2 0 0 0 0 0 0 0 2
% of Total Damages 6.9 13 7.1 37 8.0 18 3.4 7.2
Property Damages (k$) 4,583 8,278 4,689 24,273 5,337 12,131 2,286 4,773 66,351
% of Total Incidents 17.8 6.7 8.9 25.6 6.7 20.0 3.3 11.1 Natural Gas Transmission and Gathering Pipeline Incident Summary by Cause for 2002 and 2003
Number of Incidents 32 12 16 46 12 36 6 20 180
Reported Cause Excavation Damage Natural Force Damage Other Outside Force Damage Corrosion Equipment Materials Operation Other Total TABLE 12.4