
Page 548 - Corrosion Engineering Principles and Practice
P. 548
510 C h a p t e r 1 2 C o r r o s i o n a s a R i s k 511
16000
14000
Property damage (k$) 10000
12000
8000
6000
4000
2000
0
1997 1998 1999 2000 External
Year 2001 2002 2003 2004 Internal
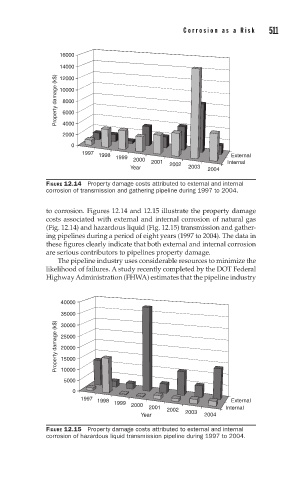
FIGURE 12.14 Property damage costs attributed to external and internal
corrosion of transmission and gathering pipeline during 1997 to 2004.
to corrosion. Figures 12.14 and 12.15 illustrate the property damage
costs associated with external and internal corrosion of natural gas
(Fig. 12.14) and hazardous liquid (Fig. 12.15) transmission and gather-
ing pipelines during a period of eight years (1997 to 2004). The data in
these figures clearly indicate that both external and internal corrosion
are serious contributors to pipelines property damage.
The pipeline industry uses considerable resources to minimize the
likelihood of failures. A study recently completed by the DOT Federal
Highway Administration (FHWA) estimates that the pipeline industry
40000
35000
Property damage (k$) 25000
30000
20000
15000
10000
5000
0
1997 1998 1999 External
2000
2001 2002 Internal
Year 2003 2004
FIGURE 12.15 Property damage costs attributed to external and internal
corrosion of hazardous liquid transmission pipeline during 1997 to 2004.