
Page 25 - Cultural Competence in Health Education
P. 25
Changing U.S. Demographics 3
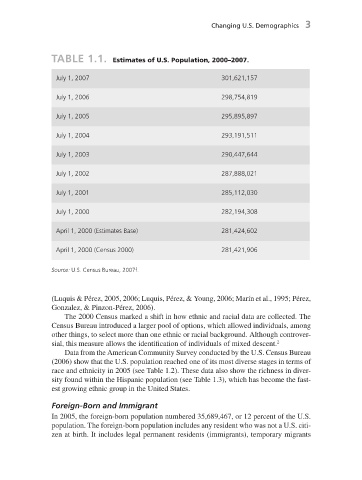
TABLE 1.1. Estimates of U.S. Population, 2000 – 2007.
July 1, 2007 301,621,157
July 1, 2006 298,754,819
July 1, 2005 295,895,897
July 1, 2004 293,191,511
July 1, 2003 290,447,644
July 1, 2002 287,888,021
July 1, 2001 285,112,030
July 1, 2000 282,194,308
April 1, 2000 (Estimates Base) 281,424,602
April 1, 2000 (Census 2000) 281,421,906
Source: U.S. Census Bureau, 2007f.
(Luquis & P é rez, 2005, 2006; Luquis, P é rez, & Young, 2006; Mar í n et al., 1995; P é rez,
Gonzalez, & Pinzon - P é rez, 2006).
The 2000 Census marked a shift in how ethnic and racial data are collected. The
Census Bureau introduced a larger pool of options, which allowed individuals, among
other things, to select more than one ethnic or racial background. Although controver-
2
sial, this measure allows the identification of individuals of mixed descent.
Data from the American Community Survey conducted by the U.S. Census Bureau
(2006) show that the U.S. population reached one of its most diverse stages in terms of
race and ethnicity in 2005 (see Table 1.2 ). These data also show the richness in diver-
sity found within the Hispanic population (see Table 1.3 ), which has become the fast-
est growing ethnic group in the United States.
Foreign - Born and Immigrant
In 2005, the foreign - born population numbered 35,689,467, or 12 percent of the U.S.
population. The foreign - born population includes any resident who was not a U.S. citi-
zen at birth. It includes legal permanent residents (immigrants), temporary migrants
7/1/08 2:49:16 PM
c01.indd 3 7/1/08 2:49:16 PM
c01.indd 3