
Page 29 - Cultural Competence in Health Education
P. 29
Changing U.S. Demographics 7
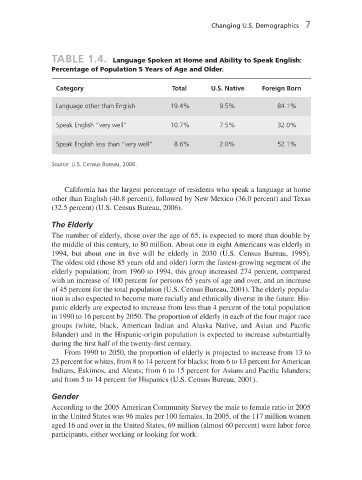
TABLE 1.4. Language Spoken at Home and Ability to Speak English:
Percentage of Population 5 Years of Age and Older.
Category Total U.S. Native Foreign Born
Language other than English 19.4 % 9.5 % 84.1 %
Speak English “ very well “ 10.7 % 7.5 % 32.0 %
Speak English less than “ very well “ 8.6 % 2.0 % 52.1 %
Source: U.S. Census Bureau, 2006.
California has the largest percentage of residents who speak a language at home
other than English (40.8 percent), followed by New Mexico (36.0 percent) and Texas
(32.5 percent) (U.S. Census Bureau, 2006).
The Elderly
The number of elderly, those over the age of 65, is expected to more than double by
the middle of this century, to 80 million. About one in eight Americans was elderly in
1994, but about one in five will be elderly in 2030 (U.S. Census Bureau, 1995).
The oldest old (those 85 years old and older) form the fastest - growing segment of the
elderly population; from 1960 to 1994, this group increased 274 percent, compared
with an increase of 100 percent for persons 65 years of age and over, and an increase
of 45 percent for the total population (U.S. Census Bureau, 2001). The elderly popula-
tion is also expected to become more racially and ethnically diverse in the future. His-
panic elderly are expected to increase from less than 4 percent of the total population
in 1990 to 16 percent by 2050. The proportion of elderly in each of the four major race
groups (white, black, American Indian and Alaska Native, and Asian and Pacifi c
Islander) and in the Hispanic - origin population is expected to increase substantially
during the first half of the twenty - fi rst century.
From 1990 to 2050, the proportion of elderly is projected to increase from 13 to
23 percent for whites, from 8 to 14 percent for blacks; from 6 to 13 percent for American
Indians, Eskimos, and Aleuts; from 6 to 15 percent for Asians and Pacifi c Islanders;
and from 5 to 14 percent for Hispanics (U.S. Census Bureau, 2001).
Gender
According to the 2005 American Community Survey the male to female ratio in 2005
in the United States was 96 males per 100 females. In 2005, of the 117 million women
aged 16 and over in the United States, 69 million (almost 60 percent) were labor force
participants, either working or looking for work.
7/1/08 2:49:18 PM
c01.indd 7 7/1/08 2:49:18 PM
c01.indd 7