
Page 26 - Cultural Competence in Health Education
P. 26
4 Cultural Competence in Health Education and Health Promotion
AK
Population, 2006
WA
ME
MT ND
MN VT
OR NH
ID SD WI NY MA RI
WY MI CT
LA PA
NE NJ
NV OH MD
UT IL IN WV DE
20,000,000 to 36,457,549 CO
CA VA
10,000,000 to 19,999,999 KS MO KY DC
5,000,000 to 9,999,999
NC
1,500,000 to 4,999,999 TN
515,004 to 1,499,999 AZ NM OK AR SC
AL GA
MS
LA
TX
FL
HI PR
Population Density Population Distribution
DC DC
9518.7 (DC) 12.2 (CA)
500.0 to 1,999.9 4.0 to 7.9
Average population 200.0 to 499.9 Percentage of 2.0 to 3.9
per square mile U.S. 84.7 to 199.9 U.S. population 1.0 to 1.9
density
84.7 50.0 to 84.6 0.2 to 0.9
1.2 to 49.9 Not included
in calculation
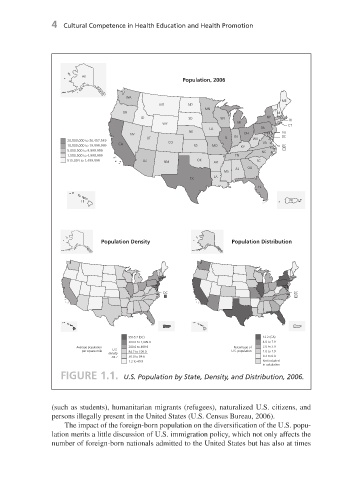
FIGURE 1.1. U.S. Population by State, Density, and Distribution, 2006.
(such as students), humanitarian migrants (refugees), naturalized U.S. citizens, and
persons illegally present in the United States (U.S. Census Bureau, 2006).
The impact of the foreign - born population on the diversification of the U.S. popu-
lation merits a little discussion of U.S. immigration policy, which not only affects the
number of foreign - born nationals admitted to the United States but has also at times
7/1/08 2:49:17 PM
c01.indd 4
c01.indd 4 7/1/08 2:49:17 PM