
Page 32 - Cultural Competence in Health Education
P. 32
10 Cultural Competence in Health Education and Health Promotion
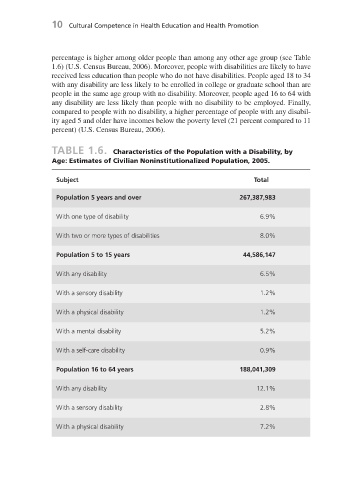
percentage is higher among older people than among any other age group (see Table
1.6 ) (U.S. Census Bureau, 2006). Moreover, people with disabilities are likely to have
received less education than people who do not have disabilities. People aged 18 to 34
with any disability are less likely to be enrolled in college or graduate school than are
people in the same age group with no disability. Moreover, people aged 16 to 64 with
any disability are less likely than people with no disability to be employed. Finally,
compared to people with no disability, a higher percentage of people with any disabil-
ity aged 5 and older have incomes below the poverty level (21 percent compared to 11
percent) (U.S. Census Bureau, 2006).
TABLE 1.6. Characteristics of the Population with a Disability, by
Age: Estimates of Civilian Noninstitutionalized Population, 2005.
Subject Total
Population 5 years and over 267,387,983
With one type of disability 6.9 %
With two or more types of disabilities 8.0 %
Population 5 to 15 years 44,586,147
With any disability 6.5 %
With a sensory disability 1.2 %
With a physical disability 1.2 %
With a mental disability 5.2 %
With a self - care disability 0.9 %
Population 16 to 64 years 188,041,309
With any disability 12.1 %
With a sensory disability 2.8 %
With a physical disability 7.2 %
7/1/08 2:49:19 PM
c01.indd 10
c01.indd 10 7/1/08 2:49:19 PM