
Page 34 - Cultural Competence in Health Education
P. 34
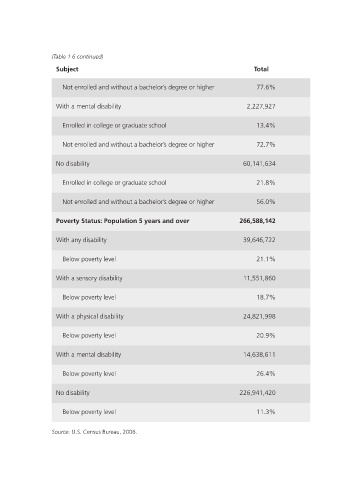
(Table 1.6 continued)
                            Subject                                              Total

                          Not enrolled and without a bachelor ’ s degree or higher     77.6 %

                            With a mental disability                           2,227,927


                          Enrolled in college or graduate school                  13.4 %
                          Not enrolled and without a bachelor ’ s degree or higher     72.7 %

                            No disability                                     60,141,634


                              Enrolled in college or graduate school              21.8 %


                          Not enrolled and without a bachelor ’ s degree or higher     56.0 %
                            Poverty Status: Population 5 years and over      266,588,142


                            With any disability                               39,646,722


                          Below poverty level                                     21.1 %
                            With a sensory disability                         11,551,860


                              Below poverty level                                 18.7 %

                            With a physical disability                        24,821,998

                              Below poverty level                                 20.9 %


                            With a mental disability                          14,638,611

                              Below poverty level                                 26.4 %

                            No disability                                    226,941,420


                              Below poverty level                                 11.3 %

                             Source:  U.S. Census Bureau, 2006.


                                                                                                  7/1/08   2:49:19 PM
          c01.indd   12                                                                           7/1/08   2:49:19 PM
          c01.indd   12