
Page 296 - Cultures and Organizations
P. 296
Yesterday, Now, or Later? 265
A third condition, however, turns out to be initial poverty. LTO explains
why some societies succeeded better than others in moving from rags to
riches, but not from riches to more riches. The successful East Asian Drag-
ons, for example, were hit by a regional economic crisis in 1997, which
abruptly cut their economic ascent.
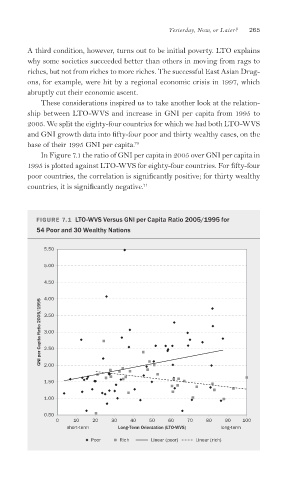
These considerations inspired us to take another look at the relation-
ship between LTO-WVS and increase in GNI per capita from 1995 to
2005. We split the eighty-four countries for which we had both LTO-WVS
and GNI growth data into fifty-four poor and thirty wealthy cases, on the
base of their 1995 GNI per capita. 70
In Figure 7.1 the ratio of GNI per capita in 2005 over GNI per capita in
1995 is plotted against LTO-WVS for eighty-four countries. For fi fty-four
poor countries, the correlation is significantly positive; for thirty wealthy
countries, it is signifi cantly negative. 71
FIGURE 7.1 LTO-WVS Versus GNI per Capita Ratio 2005/1995 for
54 Poor and 30 Wealthy Nations
5.50
5.00
4.50
4.00
GNI per Capita Ratio 2005/1995 3.50
3.00
2.50
2.00
1.50
1.00
0.50
0 10 20 30 40 50 60 70 80 90 100
short-term Long-Term Orientation (LTO-WVS) long-term
Poor Rich Linear (poor) Linear (rich)