
Page 365 - Data Architecture
P. 365
Chapter 9.1: Repetitive Analytics: Some Basics
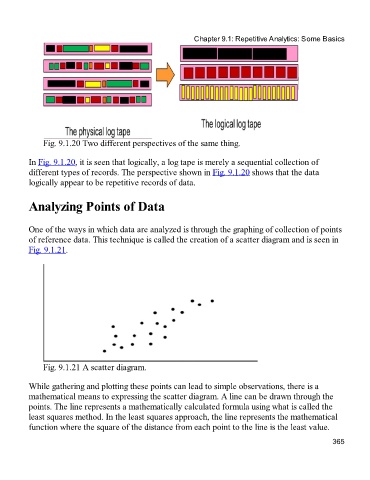
Fig. 9.1.20 Two different perspectives of the same thing.
In Fig. 9.1.20, it is seen that logically, a log tape is merely a sequential collection of
different types of records. The perspective shown in Fig. 9.1.20 shows that the data
logically appear to be repetitive records of data.
Analyzing Points of Data
One of the ways in which data are analyzed is through the graphing of collection of points
of reference data. This technique is called the creation of a scatter diagram and is seen in
Fig. 9.1.21.
Fig. 9.1.21 A scatter diagram.
While gathering and plotting these points can lead to simple observations, there is a
mathematical means to expressing the scatter diagram. A line can be drawn through the
points. The line represents a mathematically calculated formula using what is called the
least squares method. In the least squares approach, the line represents the mathematical
function where the square of the distance from each point to the line is the least value.
365