
Page 368 - Data Architecture
P. 368
Chapter 9.1: Repetitive Analytics: Some Basics
This effect—of looking at data over limited moments of time—is illustrated by a simple
example. Suppose there is an examination of the GNP of the United States over decades.
One way to measure GNP is by looking at GNP measured against dollars. So, you plot the
national GNP every 10 years or so. The problem is that over time, the dollar means
different things in terms of value. The worth of the dollar in 2015 is not the same thing at
all as the dollar in 1900. If you do not adjust your parameters of measurement for
inflation, your measurement of GNP means nothing.
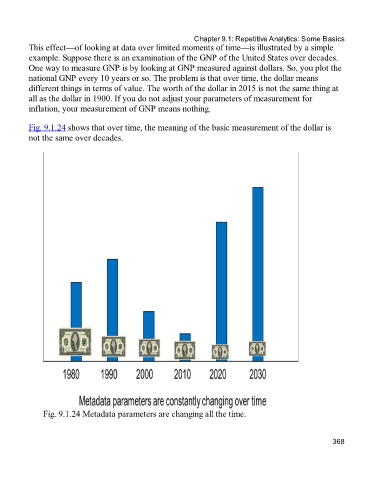
Fig. 9.1.24 shows that over time, the meaning of the basic measurement of the dollar is
not the same over decades.
Fig. 9.1.24 Metadata parameters are changing all the time.
368