
Page 77 - Data Architecture
P. 77
Chapter 1.6: The Life Cycle of Data: Understanding Data Over Time
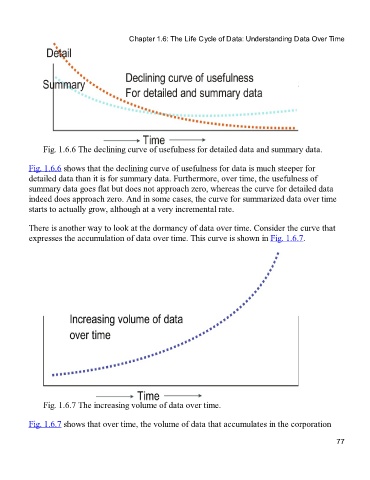
Fig. 1.6.6 The declining curve of usefulness for detailed data and summary data.
Fig. 1.6.6 shows that the declining curve of usefulness for data is much steeper for
detailed data than it is for summary data. Furthermore, over time, the usefulness of
summary data goes flat but does not approach zero, whereas the curve for detailed data
indeed does approach zero. And in some cases, the curve for summarized data over time
starts to actually grow, although at a very incremental rate.
There is another way to look at the dormancy of data over time. Consider the curve that
expresses the accumulation of data over time. This curve is shown in Fig. 1.6.7.
Fig. 1.6.7 The increasing volume of data over time.
Fig. 1.6.7 shows that over time, the volume of data that accumulates in the corporation
77