
Page 135 -
P. 135
HAN 10-ch03-083-124-9780123814791
98 Chapter 3 Data Preprocessing 2011/6/1 3:16 Page 98 #16
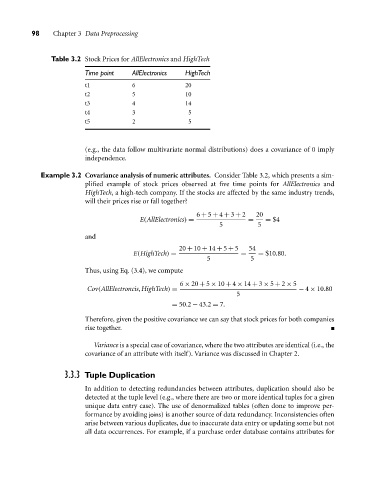
Table 3.2 Stock Prices for AllElectronics and HighTech
Time point AllElectronics HighTech
t1 6 20
t2 5 10
t3 4 14
t4 3 5
t5 2 5
(e.g., the data follow multivariate normal distributions) does a covariance of 0 imply
independence.
Example 3.2 Covariance analysis of numeric attributes. Consider Table 3.2, which presents a sim-
plified example of stock prices observed at five time points for AllElectronics and
HighTech, a high-tech company. If the stocks are affected by the same industry trends,
will their prices rise or fall together?
6 + 5 + 4 + 3 + 2 20
E(AllElectronics) = = = $4
5 5
and
20 + 10 + 14 + 5 + 5 54
E(HighTech) = = = $10.80.
5 5
Thus, using Eq. (3.4), we compute
6 × 20 + 5 × 10 + 4 × 14 + 3 × 5 + 2 × 5
Cov(AllElectroncis,HighTech) = − 4 × 10.80
5
= 50.2 − 43.2 = 7.
Therefore, given the positive covariance we can say that stock prices for both companies
rise together.
Variance is a special case of covariance, where the two attributes are identical (i.e., the
covariance of an attribute with itself). Variance was discussed in Chapter 2.
3.3.3 Tuple Duplication
In addition to detecting redundancies between attributes, duplication should also be
detected at the tuple level (e.g., where there are two or more identical tuples for a given
unique data entry case). The use of denormalized tables (often done to improve per-
formance by avoiding joins) is another source of data redundancy. Inconsistencies often
arise between various duplicates, due to inaccurate data entry or updating some but not
all data occurrences. For example, if a purchase order database contains attributes for