
Page 147 -
P. 147
HAN
10-ch03-083-124-9780123814791
110 Chapter 3 Data Preprocessing 2011/6/1 3:16 Page 110 #28
representative sample, especially when the data are skewed. For example, a stratified
sample may be obtained from customer data, where a stratum is created for each cus-
tomer age group. In this way, the age group having the smallest number of customers
will be sure to be represented.
An advantage of sampling for data reduction is that the cost of obtaining a sample
is proportional to the size of the sample, s, as opposed to N, the data set size. Hence,
sampling complexity is potentially sublinear to the size of the data. Other data reduc-
tion techniques can require at least one complete pass through D. For a fixed sample
size, sampling complexity increases only linearly as the number of data dimensions,
n, increases, whereas techniques using histograms, for example, increase exponentially
in n.
When applied to data reduction, sampling is most commonly used to estimate the
answer to an aggregate query. It is possible (using the central limit theorem) to deter-
mine a sufficient sample size for estimating a given function within a specified degree
of error. This sample size, s, may be extremely small in comparison to N. Sampling is
a natural choice for the progressive refinement of a reduced data set. Such a set can be
further refined by simply increasing the sample size.
3.4.9 Data Cube Aggregation
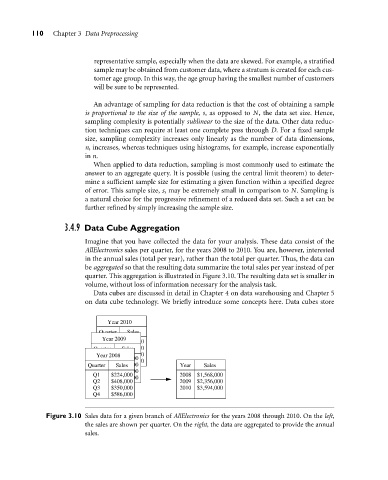
Imagine that you have collected the data for your analysis. These data consist of the
AllElectronics sales per quarter, for the years 2008 to 2010. You are, however, interested
in the annual sales (total per year), rather than the total per quarter. Thus, the data can
be aggregated so that the resulting data summarize the total sales per year instead of per
quarter. This aggregation is illustrated in Figure 3.10. The resulting data set is smaller in
volume, without loss of information necessary for the analysis task.
Data cubes are discussed in detail in Chapter 4 on data warehousing and Chapter 5
on data cube technology. We briefly introduce some concepts here. Data cubes store
Year 2010
Quarter Sales
Year 2009
Q1
$224,000
$408,000
Q2
Quarter Sales
Q3
Year 2008 $350,000
$224,000
Q1
$586,000
$408,000
Q2
Quarter Q4 Sales Year Sales
Q3 $350,000
Q1 Q4 $224,000 2008 $1,568,000
$586,000
Q2 $408,000 2009 $2,356,000
Q3 $350,000 2010 $3,594,000
Q4 $586,000
Figure 3.10 Sales data for a given branch of AllElectronics for the years 2008 through 2010. On the left,
the sales are shown per quarter. On the right, the data are aggregated to provide the annual
sales.