
Page 121 -
P. 121
100 CHAPTER 9 Align and business value
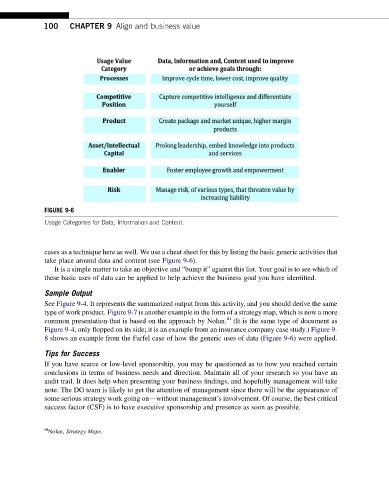
FIGURE 9-6
Usage Categories for Data, Information and Content.
cases as a technique here as well. We use a cheat sheet for this by listing the basic generic activities that
take place around data and content (see Figure 9-6).
It is a simple matter to take an objective and “bump it” against this list. Your goal is to see which of
these basic uses of data can be applied to help achieve the business goal you have identified.
Sample Output
See Figure 9-4. It represents the summarized output from this activity, and you should derive the same
type of work product. Figure 9-7 is another example in the form of a strategy map, which is now a more
iii
common presentation that is based on the approach by Nolan. (It is the same type of document as
Figure 9-4, only flopped on its side; it is an example from an insurance company case study.) Figure 9-
8 shows an example from the Farfel case of how the generic uses of data (Figure 9-6) were applied.
Tips for Success
If you have scarce or low-level sponsorship, you may be questioned as to how you reached certain
conclusions in terms of business needs and direction. Maintain all of your research so you have an
audit trail. It does help when presenting your business findings, and hopefully management will take
note. The DG team is likely to get the attention of management since there will be the appearance of
some serious strategy work going ondwithout management’s involvement. Of course, the best critical
success factor (CSF) is to have executive sponsorship and presence as soon as possible.
iii
Nolan, Strategy Maps.