
Page 455 - Decision Making Applications in Modern Power Systems
P. 455
414 Decision Making Applications in Modern Power Systems
16.2 System overview
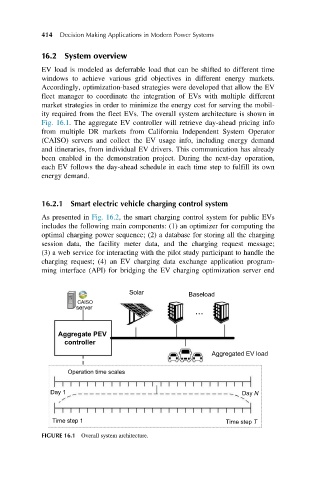
EV load is modeled as deferrable load that can be shifted to different time
windows to achieve various grid objectives in different energy markets.
Accordingly, optimization-based strategies were developed that allow the EV
fleet manager to coordinate the integration of EVs with multiple different
market strategies in order to minimize the energy cost for serving the mobil-
ity required from the fleet EVs. The overall system architecture is shown in
Fig. 16.1. The aggregate EV controller will retrieve day-ahead pricing info
from multiple DR markets from California Independent System Operator
(CAISO) servers and collect the EV usage info, including energy demand
and itineraries, from individual EV drivers. This communication has already
been enabled in the demonstration project. During the next-day operation,
each EV follows the day-ahead schedule in each time step to fulfill its own
energy demand.
16.2.1 Smart electric vehicle charging control system
As presented in Fig. 16.2, the smart charging control system for public EVs
includes the following main components: (1) an optimizer for computing the
optimal charging power sequence; (2) a database for storing all the charging
session data, the facility meter data, and the charging request message;
(3) a web service for interacting with the pilot study participant to handle the
charging request; (4) an EV charging data exchange application program-
ming interface (API) for bridging the EV charging optimization server end
Solar Baseload
CAISO
server ...
Aggregate PEV
controller
Aggregated EV load
Operation time scales
Day 1 Day N
Time step 1 Time step T
FIGURE 16.1 Overall system architecture.