
Page 476 - Decision Making Applications in Modern Power Systems
P. 476
Multistage and decentralized operations of Chapter | 16 435
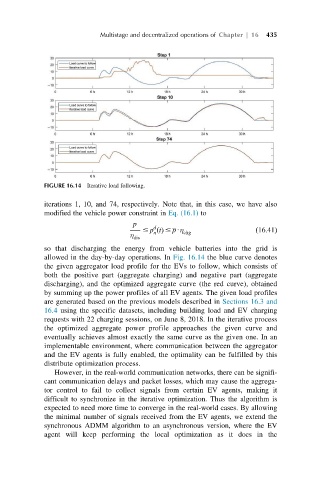
FIGURE 16.14 Iterative load following.
iterations 1, 10, and 74, respectively. Note that, in this case, we have also
modified the vehicle power constraint in Eq. (16.1) to
p d
η # p tðÞ # pUη chg ð16:41Þ
n
dis
so that discharging the energy from vehicle batteries into the grid is
allowed in the day-by-day operations. In Fig. 16.14 thebluecurve denotes
the given aggregator load profile for the EVs to follow, which consists of
both the positive part (aggregate charging) and negative part (aggregate
discharging), and the optimized aggregate curve (the red curve), obtained
by summing up the power profiles of all EV agents. The given load profiles
are generated based on the previous models described in Sections 16.3 and
16.4 using the specific datasets, including building load and EV charging
requestswith22charging sessions, on June 8, 2018. In the iterative process
the optimized aggregate power profile approaches the given curve and
eventually achieves almost exactly the same curve as the given one. In an
implementable environment, where communication between the aggregator
and the EV agents is fully enabled, the optimality can be fulfilled by this
distribute optimization process.
However, in the real-world communication networks, there can be signifi-
cant communication delays and packet losses, which may cause the aggrega-
tor control to fail to collect signals from certain EV agents, making it
difficult to synchronize in the iterative optimization. Thus the algorithm is
expected to need more time to converge in the real-world cases. By allowing
the minimal number of signals received from the EV agents, we extend the
synchronous ADMM algorithm to an asynchronous version, where the EV
agent will keep performing the local optimization as it does in the