
Page 36 - Design and Operation of Heat Exchangers and their Networks
P. 36
Basic thermal design theory for heat exchangers 23
Example 2.2 Sizing an electrically heated tube (continued)
The problem is the same as Example 2.1, which gives a safe design of
L¼0.57m. For some reason, the tube should be shortened. A mixing
disk with many small holes is assembled at the inlet of the tube so that
the inlet velocity distribution could be uniform. Considering 5%
uncertainty in the calculation of the heat transfer coefficient, evaluate the
minimal acceptable length of the heating section.
Solution
Because of the use of a mixing disk in the front of the heating section, we can
consider it as thermally and hydrodynamically developing laminar flow;
therefore, Eq. (2.21) can be used for evaluating the local heat transfer
coefficient. Since the local heat transfer coefficient in the entrance region
decreases along the tube length, the use of its mean value will
underestimate the temperature difference between the tube wall and air
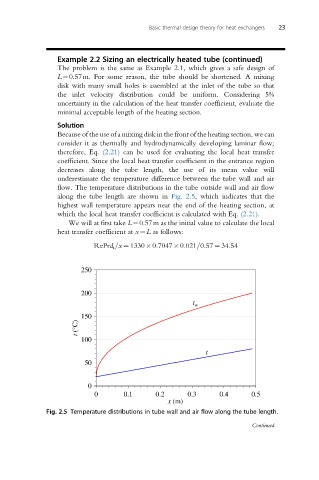
flow. The temperature distributions in the tube outside wall and air flow
along the tube length are shown in Fig. 2.5, which indicates that the
highest wall temperature appears near the end of the heating section, at
which the local heat transfer coefficient is calculated with Eq. (2.21).
We will at first take L¼0.57m as the initial value to calculate the local
heat transfer coefficient at x¼L as follows:
RePrd i =x ¼ 1330 0:7047 0:021=0:57 ¼ 34:54
250
200
t w
150
(°C)
t
100
t
50
0
0 0.1 0.2 0.3 0.4 0.5
x (m)
Fig. 2.5 Temperature distributions in tube wall and air flow along the tube length.
Continued