
Page 39 - Design and Operation of Heat Exchangers and their Networks
P. 39
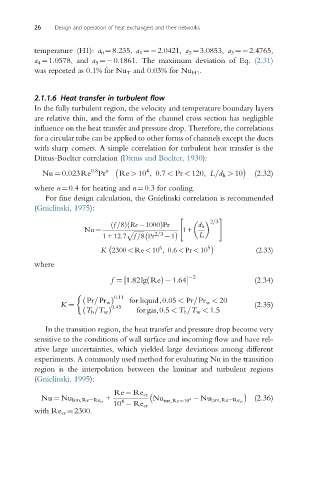
26 Design and operation of heat exchangers and their networks
temperature (H1): a 0 ¼8.235, a 1 ¼ 2.0421, a 2 ¼3.0853, a 3 ¼ 2.4765,
a 4 ¼1.0578, and a 5 ¼ 0.1861. The maximum deviation of Eq. (2.31)
was reported as 0.1% for Nu T and 0.03% for Nu H1 .
2.1.1.6 Heat transfer in turbulent flow
In the fully turbulent region, the velocity and temperature boundary layers
are relative thin, and the form of the channel cross section has negligible
influence on the heat transfer and pressure drop. Therefore, the correlations
for a circular tube can be applied to other forms of channels except the ducts
with sharp corners. A simple correlation for turbulent heat transfer is the
Dittus-Boelter correlation (Dittus and Boelter, 1930):
4
n
0:8
Nu ¼ 0:023Re Pr Re > 10 ,0:7 < Pr < 120, L=d h > 10 (2.32)
where n¼0.4 for heating and n¼0.3 for cooling.
For fine design calculation, the Gnielinski correlation is recommended
(Gnielinski, 1975):
" #
2=3
ð f =8Þ Re 1000ÞPr d h
ð
Nu ¼ p ffiffiffiffiffiffiffi 2=3 1+
1+12:7 f =8 Pr 1 L
6 5
K 2300 < Re < 10 ,0:6 < Pr < 10 (2.33)
where
2
f ¼ 1:82lg ReÞ 1:64 (2.34)
½
ð
0:11
ð Pr=Pr w Þ for liquid,0:05 < Pr=Pr w < 20
K ¼ 0:45 (2.35)
ð T b =T w Þ for gas,0:5 < T b =T w < 1:5
In the transition region, the heat transfer and pressure drop become very
sensitive to the conditions of wall surface and incoming flow and have rel-
ative large uncertainties, which yielded large deviations among different
experiments. A commonly used method for evaluating Nu in the transition
region is the interpolation between the laminar and turbulent regions
(Gnielinski, 1995):
Re Re cr
+ Nu (2.36)
4
Nu ¼ Nu lam,Re¼Re cr tur,Re¼10 4 Nu lam,Re¼Re cr
10 Re cr
with Re cr ¼2300.