
Page 124 - Design for Environment A Guide to Sustainable Product Development
P. 124
Performance Indicators and Metrics 103
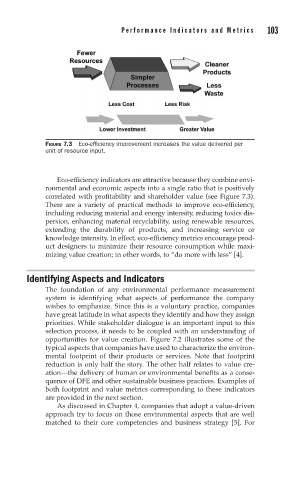
FIGURE 7.3 Eco-effi ciency improvement increases the value delivered per
unit of resource input.
Eco-efficiency indicators are attractive because they combine envi-
ronmental and economic aspects into a single ratio that is positively
correlated with profitability and shareholder value (see Figure 7.3).
There are a variety of practical methods to improve eco-efficiency,
including reducing material and energy intensity, reducing toxics dis-
persion, enhancing material recyclability, using renewable resources,
extending the durability of products, and increasing service or
knowledge intensity. In effect, eco-efficiency metrics encourage prod-
uct designers to minimize their resource consumption while maxi-
mizing value creation; in other words, to “do more with less” [4].
Identifying Aspects and Indicators
The foundation of any environmental performance measurement
system is identifying what aspects of performance the company
wishes to emphasize. Since this is a voluntary practice, companies
have great latitude in what aspects they identify and how they assign
priorities. While stakeholder dialogue is an important input to this
selection process, it needs to be coupled with an understanding of
opportunities for value creation. Figure 7.2 illustrates some of the
typical aspects that companies have used to characterize the environ-
mental footprint of their products or services. Note that footprint
reduction is only half the story. The other half relates to value cre-
ation—the delivery of human or environmental benefits as a conse-
quence of DFE and other sustainable business practices. Examples of
both footprint and value metrics corresponding to these indicators
are provided in the next section.
As discussed in Chapter 4, companies that adopt a value-driven
approach try to focus on those environmental aspects that are well
matched to their core competencies and business strategy [5]. For