
Page 130 - Design for Environment A Guide to Sustainable Product Development
P. 130
Performance Indicators and Metrics 109
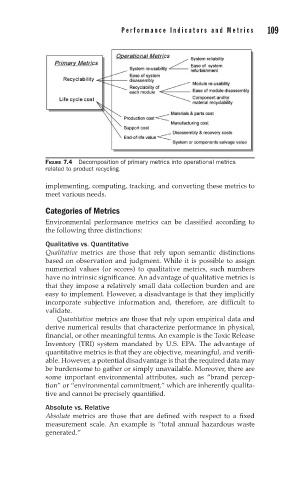
FIGURE 7.4 Decomposition of primary metrics into operational metrics
related to product recycling.
implementing, computing, tracking, and converting these metrics to
meet various needs.
Categories of Metrics
Environmental performance metrics can be classified according to
the following three distinctions:
Qualitative vs. Quantitative
Qualitative metrics are those that rely upon semantic distinctions
based on observation and judgment. While it is possible to assign
numerical values (or scores) to qualitative metrics, such numbers
have no intrinsic significance. An advantage of qualitative metrics is
that they impose a relatively small data collection burden and are
easy to implement. However, a disadvantage is that they implicitly
incorporate subjective information and, therefore, are difficult to
validate.
Quantitative metrics are those that rely upon empirical data and
derive numerical results that characterize performance in physical,
financial, or other meaningful terms. An example is the Toxic Release
Inventory (TRI) system mandated by U.S. EPA. The advantage of
quantitative metrics is that they are objective, meaningful, and verifi-
able. However, a potential disadvantage is that the required data may
be burdensome to gather or simply unavailable. Moreover, there are
some important environmental attributes, such as “brand percep-
tion” or “environmental commitment,” which are inherently qualita-
tive and cannot be precisely quantified.
Absolute vs. Relative
Absolute metrics are those that are defined with respect to a fixed
measurement scale. An example is “total annual hazardous waste
generated.”