
Page 132 - Design for Environment A Guide to Sustainable Product Development
P. 132
Performance Indicators and Metrics 111
even existence) of the impacts may be speculative, the use of a source
metric allows companies and regulatory agencies to establish clear
targets for improvement.
Example: As part of its pioneering 3P initiative described in Chapter 10, Pollution
Prevention Pays, 3M developed a measure of eco-efficiency called a waste ratio
that is useful for application to manufacturing facilities [7]. It is calculated as
follows:
Waste ratio = Waste
+
+
Product By-product Wastte
This is a quantitative relative source metric, since waste volume is measured
relative to the total material output of the plant. In order to minimize this ratio,
engineers can either convert waste to useful by-products or reduce the waste
generated.
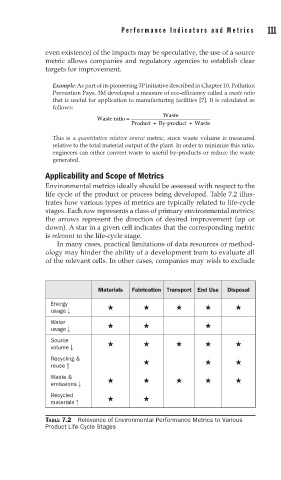
Applicability and Scope of Metrics
Environmental metrics ideally should be assessed with respect to the
life cycle of the product or process being developed. Table 7.2 illus-
trates how various types of metrics are typically related to life-cycle
stages. Each row represents a class of primary environmental metrics;
the arrows represent the direction of desired improvement (up or
down). A star in a given cell indicates that the corresponding metric
is relevant to the life-cycle stage.
In many cases, practical limitations of data resources or method-
ology may hinder the ability of a development team to evaluate all
of the relevant cells. In other cases, companies may wish to exclude
Materials Fabrication Transport End Use Disposal
Energy
usage
Water
usage
Source
volume
Recycling &
reuse
Waste &
emissions
Recycled
materials
TABLE 7.2 Relevance of Environmental Performance Metrics to Various
Product Life-Cycle Stages